Category Stock Value
Watch the full video tutorial for Category Stock Value in ALZERP Cloud ERP
The Category Stock Value feature in ALZERP provides insights into the value of inventory categorized by product types. This functionality helps businesses analyze inventory composition, identify high-value categories, and make informed inventory management decisions.
Key Features:
- Search Criteria: Allows searching for category stock value on a specific date.
- Report Type: Offers summary or detailed reports.
- Product Category Filter: Enables filtering by specific product categories.
- Summary Report: Displays total quantity, purchase value, and sales value for each product category.
- Detailed Report: Provides a breakdown of individual products within a category, including quantity, purchase value, and sales value.
The Category Stock Value feature in ALZERP cloud ERP software provides an insightful report that helps users understand the value and quantity of stock held within different product categories. This report is essential for inventory management, financial analysis, and strategic planning. Here’s a detailed explanation:
Category Stock Search Form
Purpose:
To generate a report that shows the stock value for different product categories as of a specific date. The report can be viewed in summary or detailed format.
Form Fields:
- As On: The date for which the stock value report is to be generated (e.g., 05/08/2024).
- Report Type: Choose between ‘Summary’ or ‘Detail’ report.
- Product Category: Filter by a specific category or view all categories.
Report Types
Summary Report:
Provides an overview of each product category’s stock value, including total quantity, purchase value, and sales value.
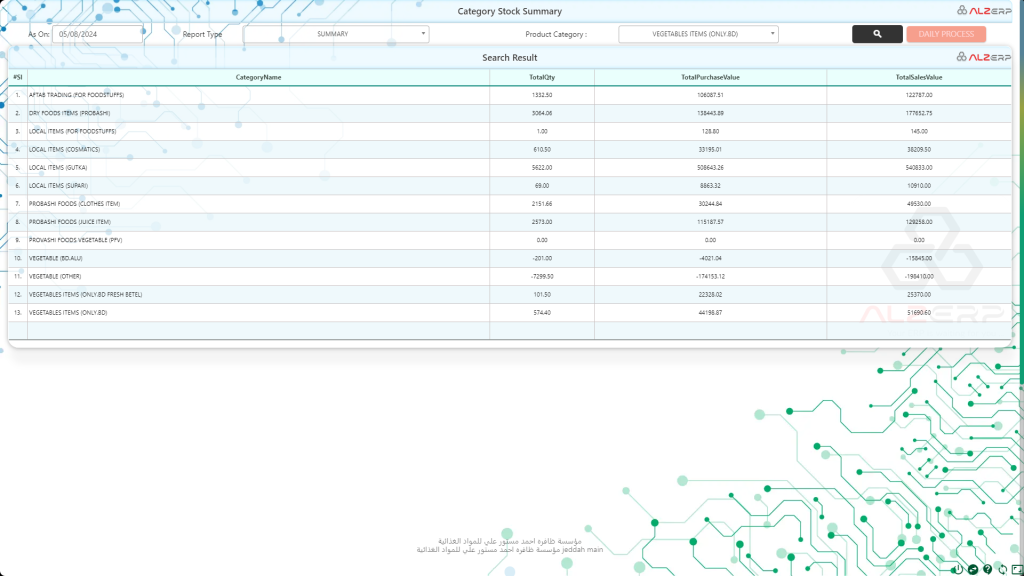
Columns in Summary Report:
- #Sl: Serial number.
- Category Name: Name of the product category.
- Total Qty: Total quantity of items in the category.
- Total Purchase Value: Total purchase value of items in the category.
- Total Sales Value: Total sales value of items in the category.
Sample Summary Data:
markdownCopy code#Sl  CategoryName                           TotalQty  TotalPurchaseValue  TotalSalesValue
1.   AFTAB TRADING (FOR FOODSTUFFS)        1332.50    106087.51           122787.00
2.   DRY FOODS ITEMS (PROBASHI)            3064.06    138443.89           177652.75
3.   LOCAL ITEMS (FOR FOODSTUFFS)          1.00       128.80              145.00
4.   LOCAL ITEMS (COSMATICS)               610.50     33195.01            38209.50
5.   LOCAL ITEMS (GUTKA)                   5622.00    508643.26           540833.00
6.   LOCAL ITEMS (SUPARI)                  69.00      8863.32             10910.00
7.   PROBASHI FOODS (CLOTHES ITEM)         2151.66    30244.84            49530.00
8.   PROBASHI FOODS (JUICE ITEM)           2573.00    115187.57           129258.00
9.   PROVASHI FOODS VEGETABLE (PFV)        0.00       0.00                0.00
10.  VEGETABLE (BD.ALU)                    -201.00    -4021.04            -15845.00
11.  VEGETABLE (OTHER)                     -7299.50   -174153.12          -198410.00
12.  VEGETABLES ITEMS (ONLY.BD FRESH BETEL)101.50     22328.02            25370.00
13.  VEGETABLES ITEMS (ONLY.BD)            574.40     44198.87            51690.60
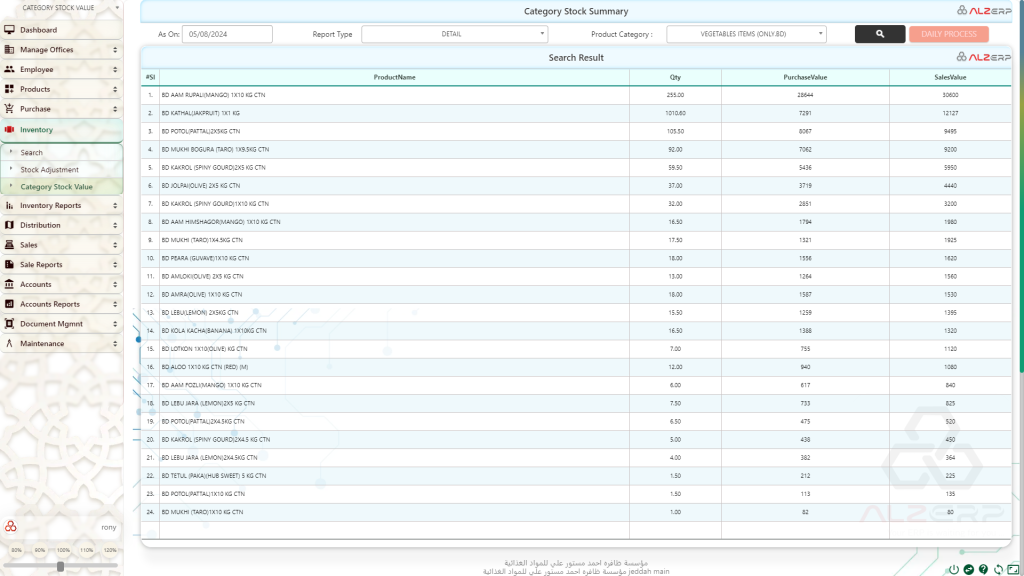
Detail Report:
Provides a detailed view of stock items within a specific category, including quantity, purchase value, and sales value for each product.

Columns in Detail Report:
- #Sl: Serial number.
- Product Name: Name of the product.
- Qty: Quantity of the product.
- Purchase Value: Purchase value of the product.
- Sales Value: Sales value of the product.
Sample Detail Data:
scssCopy code#Sl ProductName                                Qty    PurchaseValue  SalesValue
1.  BD AAM RUPALI(MANGO) 1X10 KG CTN           255.00 28644          30600
2.  BD KATHAL(JAKPRUIT) 1X1 KG                 1010.60 7291           12127
3.  BD POTOL(PATTAL)2X5KG CTN                  105.50 8067            9495
4.  BD MUKHI BOGURA (TARO) 1X9.5KG CTN         92.00  7062            9200
5.  BD KAKROL (SPINY GOURD)2X5 KG CTN          59.50  5436            5950
6.  BD JOLPAI(OLIVE) 2X5 KG CTN                37.00  3719            4440
7.  BD KAKROL (SPINY GOURD)1X10 KG CTN         32.00  2851            3200
8.  BD AAM HIMSHAGOR(MANGO) 1X10 KG CTN        16.50  1794            1980
9.  BD MUKHI (TARO)1X4.5KG CTN                 17.50  1321            1925
10. BD PEARA (GUVAVE)1X10 KG CTN               18.00  1556            1620
11. BD AMLOKI(OLIVE) 2X5 KG CTN                13.00  1264            1560
12. BD AMRA(OLIVE) 1X10 KG CTN                 18.00  1587            1530
13. BD LEBU(LEMON) 2X5KG CTN                   15.50  1259            1395
14. BD KOLA KACHA(BANANA) 1X10KG CTN           16.50  1388            1320
15. BD LOTKON 1X10(OLIVE) KG CTN               7.00   755             1120
16. BD ALOO 1X10 KG CTN (RED) (M)              12.00  940             1080
17. BD AAM FOZLI(MANGO) 1X10 KG CTN            6.00   617             840
18. BD LEBU JARA (LEMON)2X5 KG CTN             7.50   733             825
19. BD POTOL(PATTAL)2X4.5KG CTN                6.50   475             520
20. BD KAKROL (SPINY GOURD)2X4.5 KG CTN        5.00   438             450
21. BD LEBU JARA (LEMON)2X4.5KG CTN            4.00   382             364
Key Features
- Flexibility in Reporting: Users can choose between a summary report for an overview or a detailed report for in-depth analysis.
- Date-Specific Reporting: Reports can be generated as of a specific date, providing timely information for decision-making.
- Category and Product Filtering: Users can filter the report by specific categories or view all categories.
- Valuation Metrics: The reports include important metrics such as total quantity, purchase value, and sales value, aiding in financial and inventory analysis.
Use Case Scenario
Imagine a sales manager who wants to assess the current value of the stock for different product categories as of a specific date. They can generate a summary report to get an overall view of the stock values across categories. If they need detailed information about specific products within a category, they can switch to the detailed report, which provides individual product details including quantities, purchase values, and sales values. This helps the manager to make informed decisions about stock management, pricing strategies, and procurement planning.
By utilizing the Category Stock Value feature, businesses can maintain a clear and comprehensive understanding of their inventory’s financial worth, ensuring better control over stock and more accurate financial reporting.
How it Works:
- Date Selection: Specify the desired date for the report.
- Report Type Selection: Choose between summary or detailed report.
- Category Filter (Optional): Select a specific product category (optional).
- Report Generation: The system generates the report based on the selected criteria.
- Report Analysis: View the total or individual product values within each category.
Benefits:
- Category Analysis: Analyzes the value of inventory by product category.
- Inventory Management: Supports informed decisions about inventory allocation, purchasing, and pricing strategies.
- Financial Insights: Provides insights into the financial value of different product categories.
- Cost Control: Helps identify cost-saving opportunities through category analysis.
Potential Additional Features:
- Comparative Analysis: Compare category stock values across different periods.
- Category Hierarchy: Display stock value across subcategories within a category structure.
- Inventory Turnover Calculation: Calculate inventory turnover ratios for each category.
- Sales Performance Analysis: Analyze sales performance of different product categories.
By offering a comprehensive view of category stock value, ALZERP empowers businesses to optimize inventory management, improve financial performance, and make data-driven decisions.